
How to get the most out of this dashboard
- Read through from top to bottom to get the whole story
- Scroll over the charts to get nitty gritty details
- Click on a color in the Key to hone in on that selection
- Enter Full Screen Mode by clicking this button
 in the lower right of each chart
Note: Dollar values are adjusted for inflation to 2025 dollars.
How does Food Insecurity Happen?

What is food access?
Food access exists when individuals have adequate resources for acquiring appropriate foods for a nutritious diet.
What is food security?
Food security exists when all people at all times have physical and economic access to sufficient, safe, and nutritious foods.
What is nutrition security?
Nutrition security requires access to adequate and appropriate healthcare services, along with a diet that meets the nutritional needs for a healthy and active life. Cultural relevance of food is also an important aspect of nutrition security.
Figure Inspired By: Hill, D. (2018, June 27). To Achieve Food Security For All, Build Trust With Communities. Duke Today.
Food Security in New England, 2000-2024
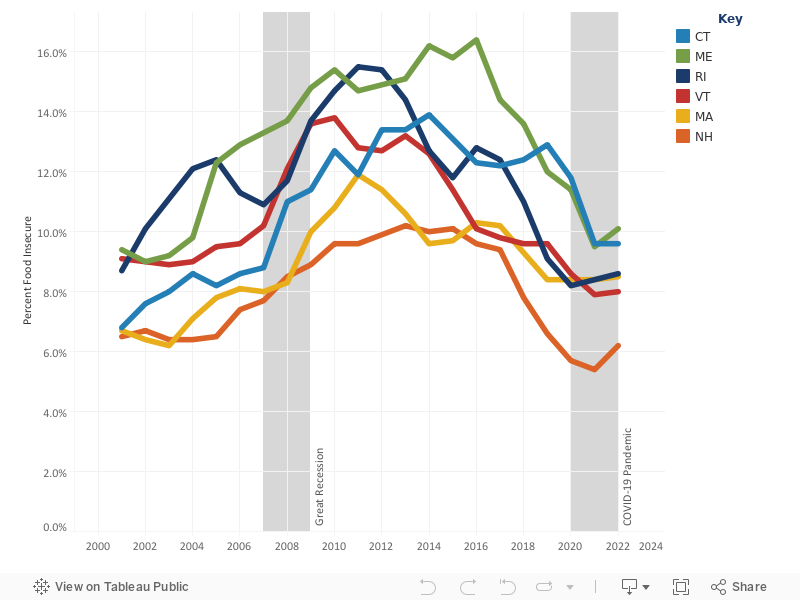
Click on the the dark blue box in the key to see the Rhode Island trend line.
Food insecurity is defined by the USDA as the lack of consistent access to enough food for a healthy and active life. Food insecurity is rooted in poverty and economic upheaval: it spiked for the New England states as a result of the Great Recession and the COVID-19 pandemic. Food insecurity is on the rise again throughout the country, but the federal government ended this research program in 2025.
Food Security in Rhode Island, 2000-2024
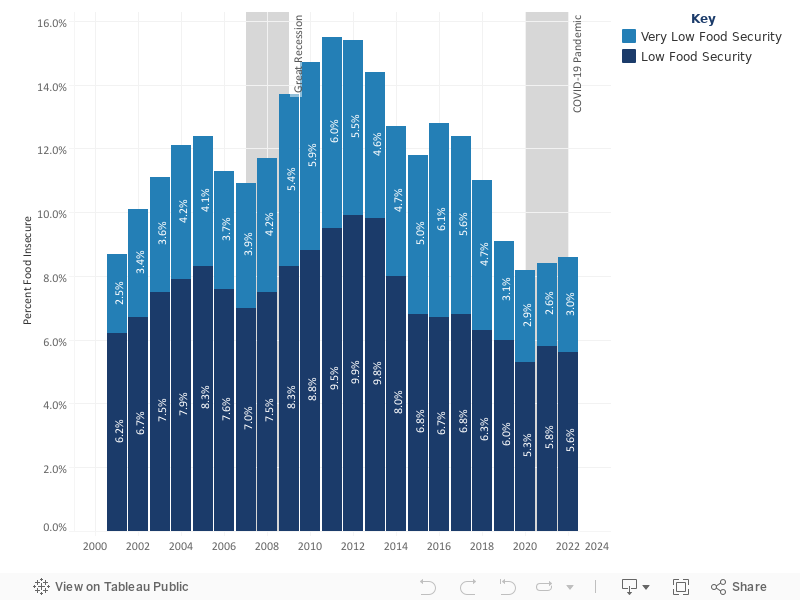
Data Sources: Rabbitt, M. P., Reed-Jones, M., Hales, L. J., Suttles, Shellye, & Burke, M. P. (2024). Household food security in the United States in 2024 (Report No. ERR-358). U.S. Department of Agriculture, Economic Research Service. Note that USDA estimates for states represent 3-year averages (e.g., 2019-2021, 2022-2024).
Poverty and Food Insecurity in Rhode Island, 2001-2024
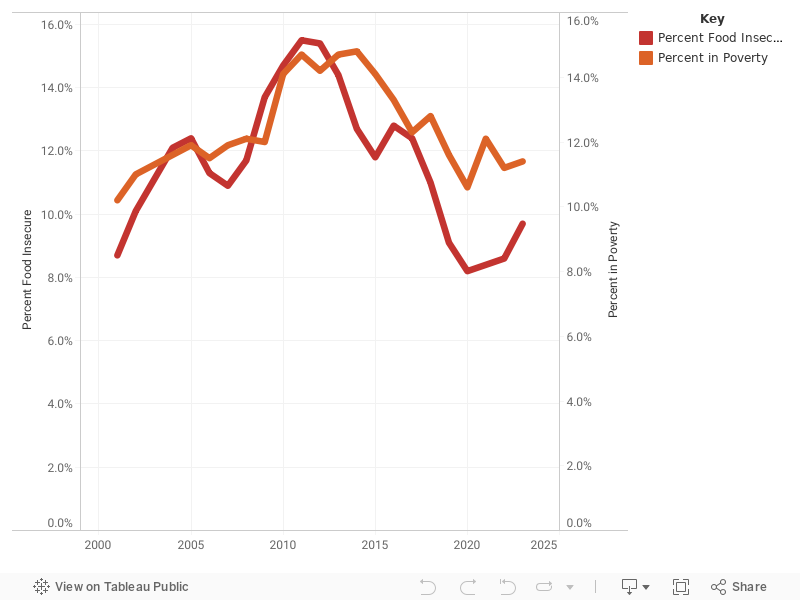
Data Sources: U.S. Census Bureau Small Area Income and Poverty Estimates (via FRED) and USDA Economic Research Service, Household Food Security in the United States, multiple years.
Low Income/Low Access Census Tracts by Race/Ethnicity
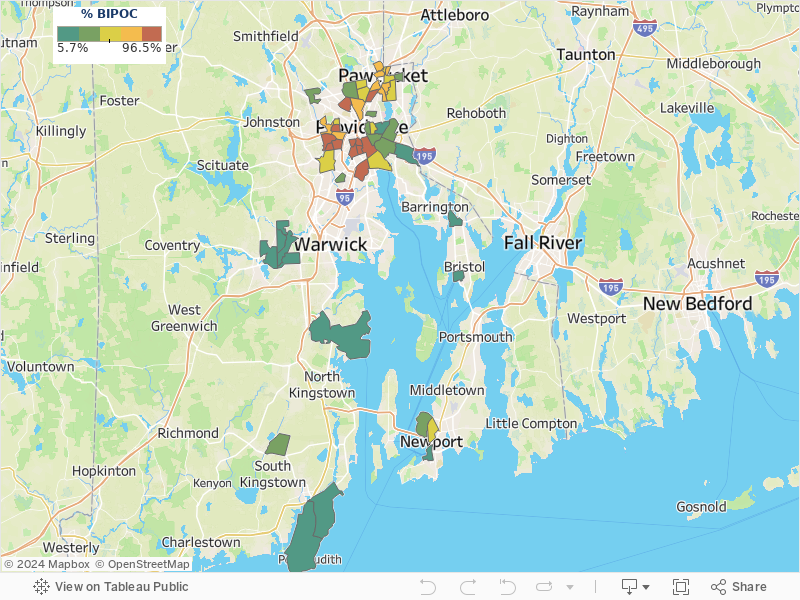
Social and commercial determinants also set the stage for lifelong disparities in food access by race/ethnicity and income. Sorting these low income/low access census tracts by race and Hispanic ethnicity, we find a strong correlation between the percentage of residents who identify as Black, Indigenous, and/or other people of color and low income/low access. Hispanic/Latino, Black, Asian, Indigenous, and Rhode Islanders of two or more races or some “other” race—make up 32.0% of the state’s population, but 53.6% of its population living in low-income low- access census tracts.
Data Sources: Low income/low access classification: USDA Food Access Research Atlas. Race/ethnicity demographics: American Community Survey, Table B03002: Hispanic or Latino Origin by Race, 2024 5-Year Estimates.
Food Insecurity in Rhode Island by Race/Ethnicity, 2020-2025

SNAP Participation in Rhode Island by County, 1997-2023
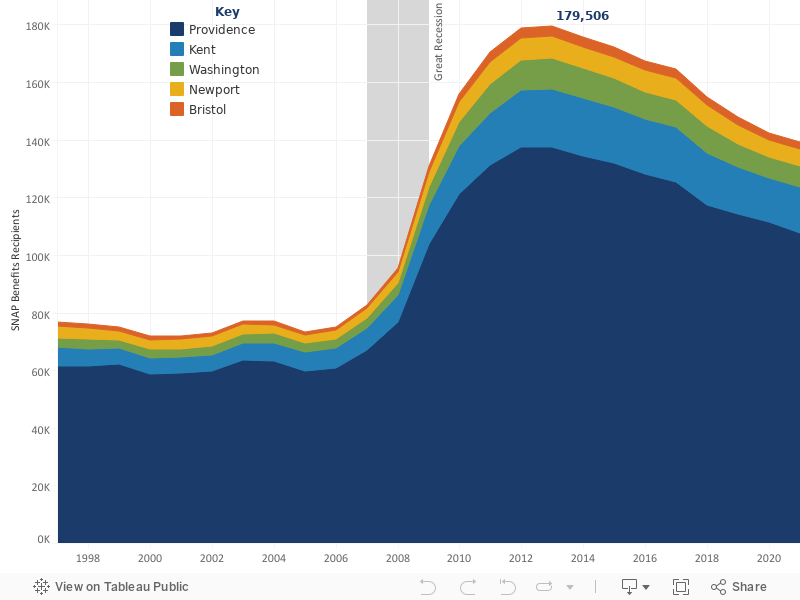
The number of Rhode Island residents receiving SNAP benefits more than doubled during the Great Recession, and has not come down to previous levels since.
Providence County, where most of the state’s population lives, has the largest number of SNAP recipients.
Data Sources: U.S. Census Bureau, SNAP Benefits Recipients in Rhode Island [BRRI44M647NCEN], retrieved from FRED, Federal Reserve Bank of St. Louis.
SNAP Participation in Rhode Island by Race/Ethnicity, 1997-2024
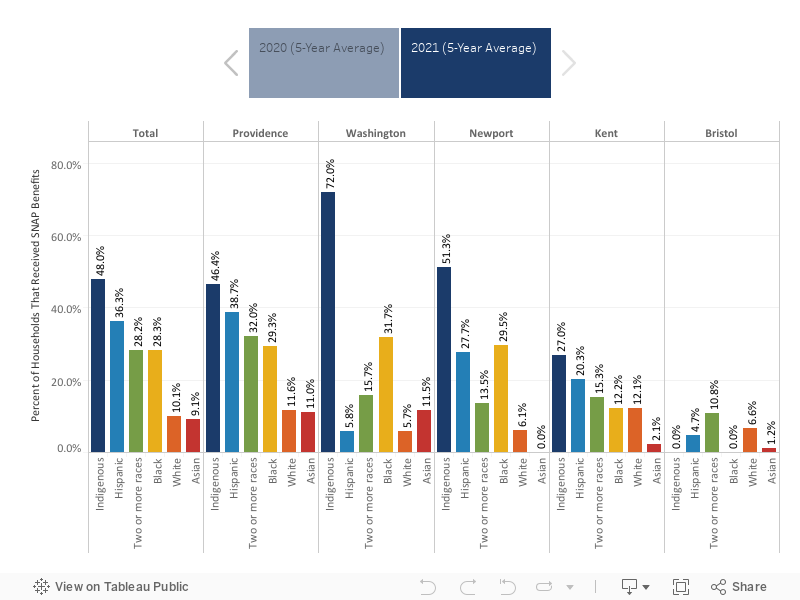
Low wages ripple throughout society as food system workers are disproportionately impacted by food and nutrition insecurity. From 2020 to 2024, an average of 16.3% (68,111) of Rhode Island households received Supplemental Nutritional Assistance Program (SNAP) benefits to augment their grocery budgets. White Rhode Islanders make up the majority of the state’s population (66.1%) and, consequently, the largest number of SNAP recipients in Rhode Island were White. But only 9.6% of White households received SNAP benefits.
In contrast:
- Hispanic Rhode Islanders make up 18.8% of the state’s population and 33.7% of Hispanic
households received SNAP benefits. - Black Rhode Islanders make up 4.8% of the
state’s population and 24.4% of Black house-
holds received SNAP benefits. - Indigenous Rhode Islanders make up 0.2% of
the state’s population and 29.9% of
Indigenous households received SNAP
benefits.
Data Sources: U.S. Census Bureau American Community Survey, Receipt of Food Stamps/SNAP in Past 12 Months by Race of Householder. 2024 5-Year Estimates.
National School Lunch Participation in Rhode Island, 2001-2025
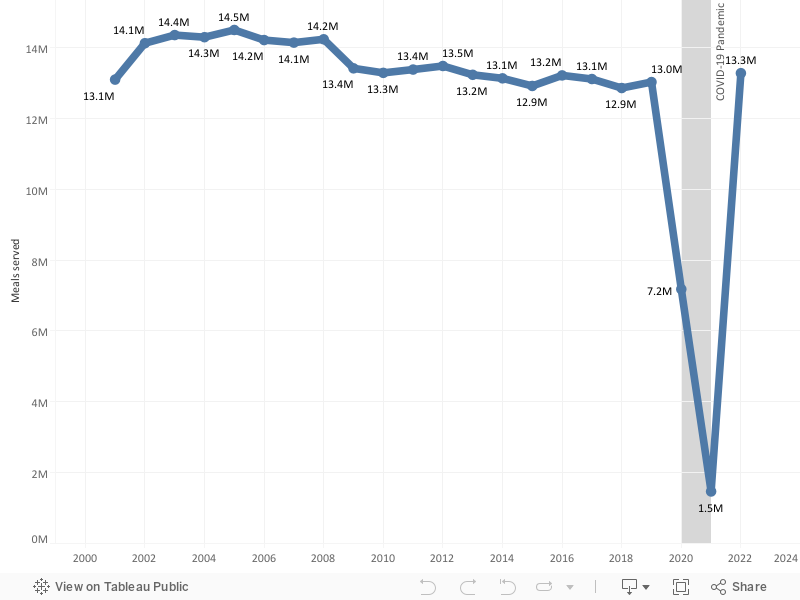
When schools closed during the pandemic, school lunches were served under the Summer Food Service Program which allowed for a “grab and go” style of distribution. Since 2023, the number of school meals served has been more than 1 million below the historic average.
Data Sources: USDA Food and Nutrition Service, SNAP data tables.
WIC (Women, Infants & Children) Program Participation in Rhode Island, 2017-2025
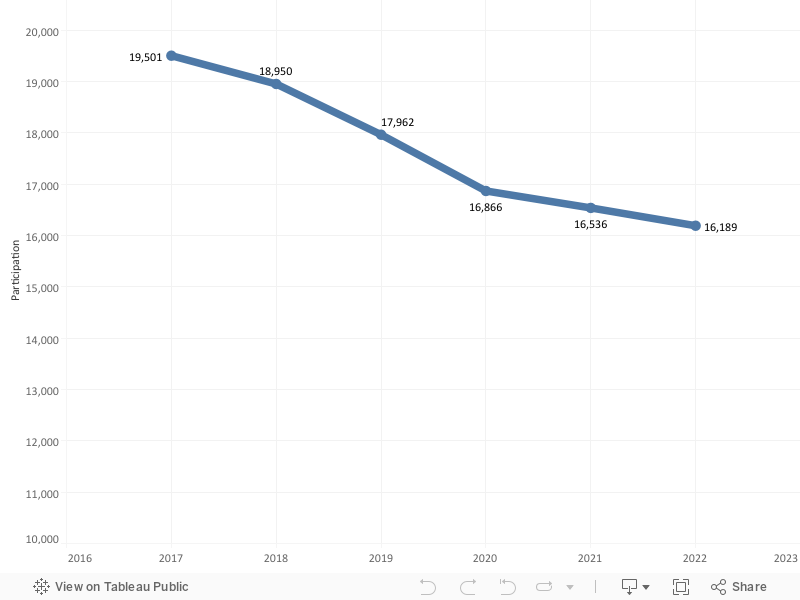
In Rhode Island about 18,000 people participated in the program in 2025, down from 19,500 in 2017. Reduced enrollment in Rhode Island is consistent with national trends.
Data Sources: USDA Food and Nutrition Service, WIC data tables.
Number of People Served by the Rhode Island Charitable Food System, 2016-2025
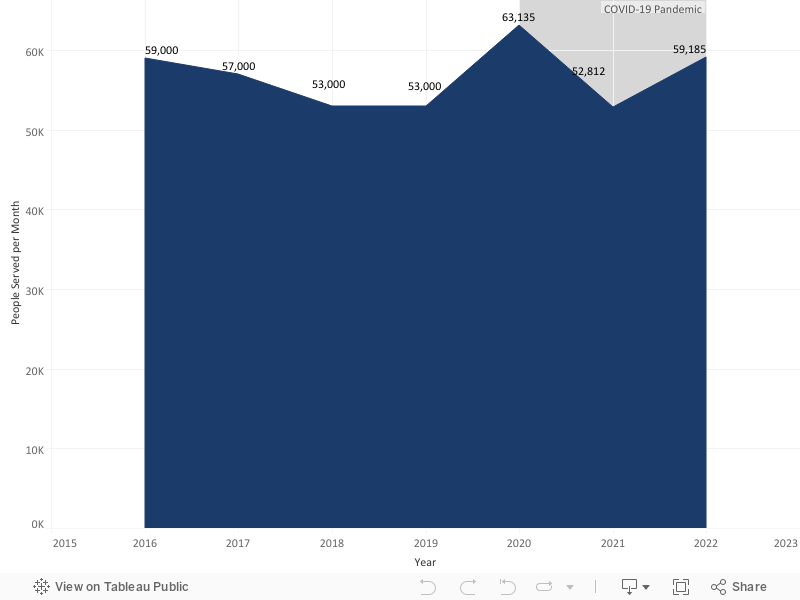
Many other individuals are served by programs outside of the RI Community Food Bank network organizations.
Data Sources: Rhode Island Community Food Bank, 2025 Status Report on Hunger in Rhode Island.