
How to get the most out of this dashboard
- Read through from top to bottom to get the whole story
- Scroll over the charts to get nitty gritty details
- Click on a color in the Key to hone in on that selection
- Enter Full Screen Mode by clicking this button
 in the lower right of each chart
Note: Dollar values are adjusted for inflation to 2025 dollars.
Land in Agriculture in Rhode Island by County, 2002-2022
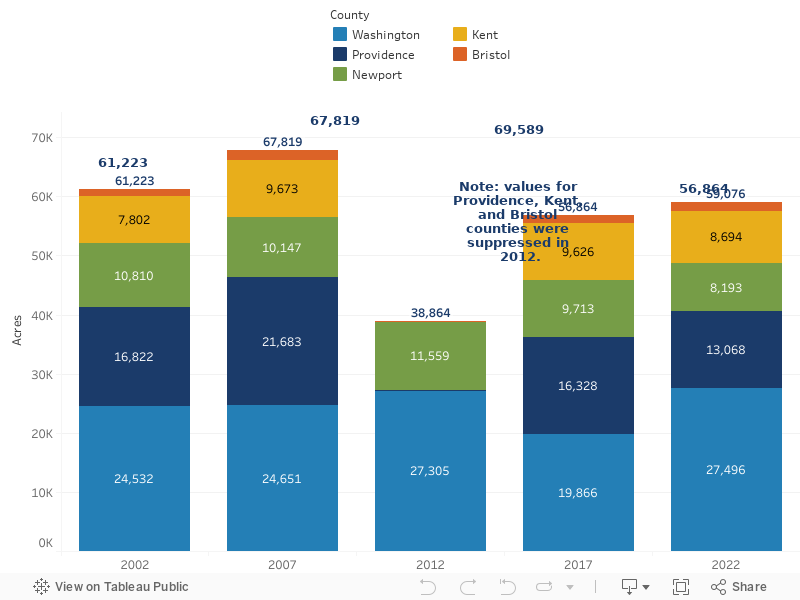
The USDA Census of Agriculture is conducted every 5 years and provides foundational information on characteristics of agriculture in every county and state in the country. Back in 1920, Rhode Island had an estimated 331,600 acres in farmland. As of the 2022 Census of Agriculture, Rhode Island was estimated to have 59,076 acres in farmland, which is an increase from 56,864 in 2017. In 2022, Washington County accounted for 46.5% (27,496 acres, an increase from 19,866 acres in 2017) of land in agriculture, while Providence County made up about 22.1% (13,068 acres). Newport, Kent, and Bristol counties contain much smaller amounts of land in agriculture.
Data sources: USDA Census of Agriculture, Table 1: County Summary Highlights, multiple years. Note: data for Providence and Washington counties was suppressed in 2012; data for Bristol and Kent counties was suppressed in 2002.
Land in Agriculture in Rhode Island by Category, 2002-2022
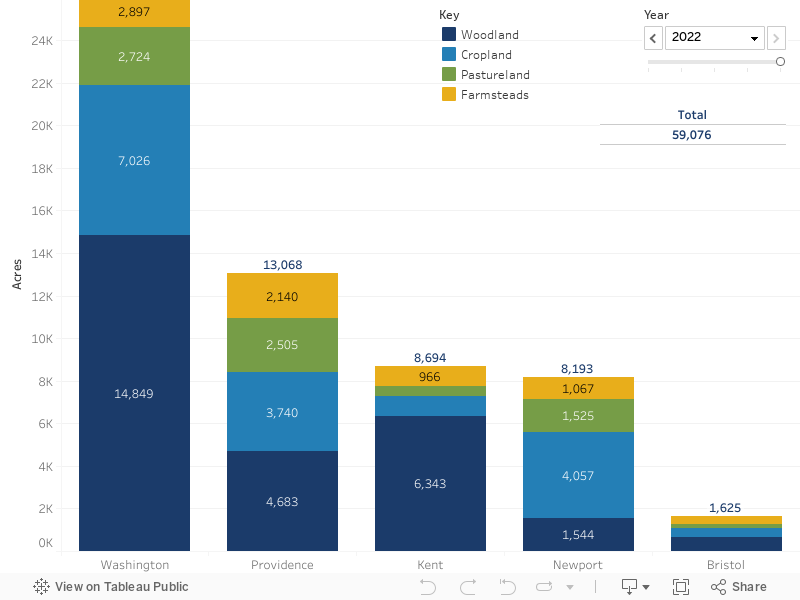
This chart has an interactive menu!
Click the Year menu on the left and use the arrows for more information.

Woodland is the largest category of agricultural land in Rhode Island: 27,595 acres (46.7%) of total in 2022. Woodland includes natural or planted woodlots or timber tracts, cutover and deforested land with young growth which has or will have value for wood products, and woodland pastured. It also includes land with tapped maple trees. Total cropland in Rhode Island equaled 16,665 acres (28.2%) in 2022, and is mostly hay and other forage, followed by vegetables, corn for animal feed, and fruit orchards.
Note: data is suppressed for some counties and categories for multiple years.
Data sources: USDA Census of Agriculture, Table 1: County Summary Highlights, multiple years.
Projected Agricultural Land Conversion

According to the 2022 USDA Census of Agriculture, Rhode Island had 59,076 acres of agriculture. A decrease of 8,100 acres would mean a 13.7% decrease in available farmland.
Data sources: USDA 2022 Census of Agriculture, Table 8: Farms, Land in Farms, Value of Land and Buildings, and Land Use: 2022 and 2017.
Figure: Hunter, M., A. Sorensen, T. Nogeire-McRae, S. Beck, S. Shutts, R. Murphy. 2022. Farms Under Threat 2040: Choosing an Abundant Future. Washington, D.C.: American Farmland Trust.
Farm Real Estate Average Value Per Acre, 2006-2024
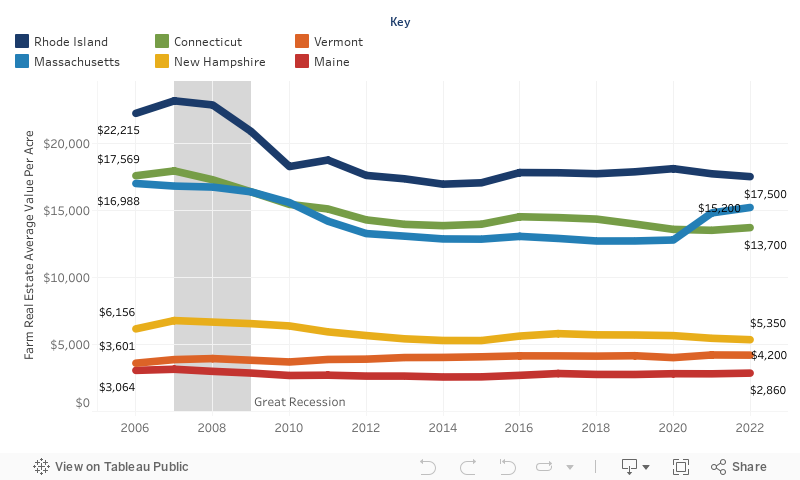
Data sources: USDA NASS, Land Values Summary, multiple years.
Number of Farms in Rhode Island by County, 2002-2022
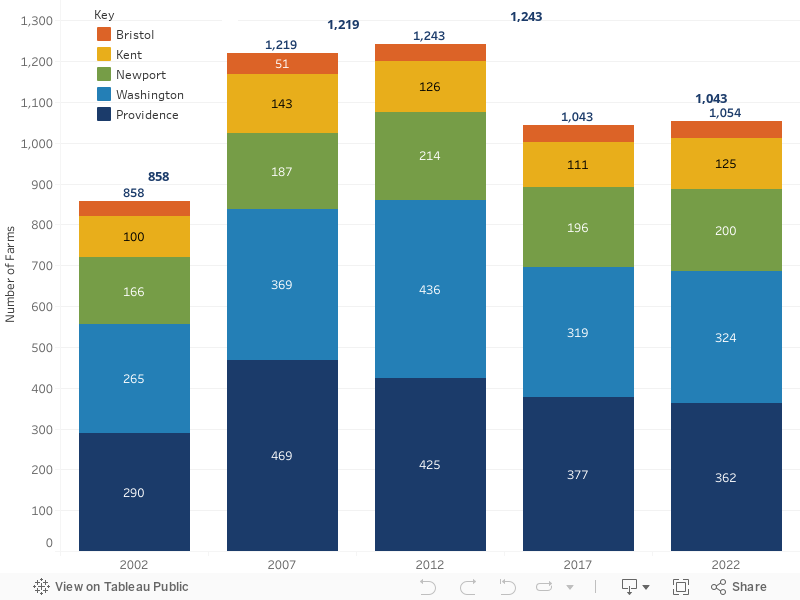
In 2022, Providence County accounted for 34.3% of farms (362), with an average farm size of 36 acres (the average size of a farm in the United States in 2022 was 463 acres). Washington County accounted for 30.7% of farms (324), with an average farm of 85 acres.
Data sources: USDA Census of Agriculture,Table 1: Historical Highlights, multiple years. Note: USDA estimates of aquaculture sites may not align with estimates from RI Coastal Resources Management Council.
Number of Farms in Rhode Island by County and Category, 2002-2022
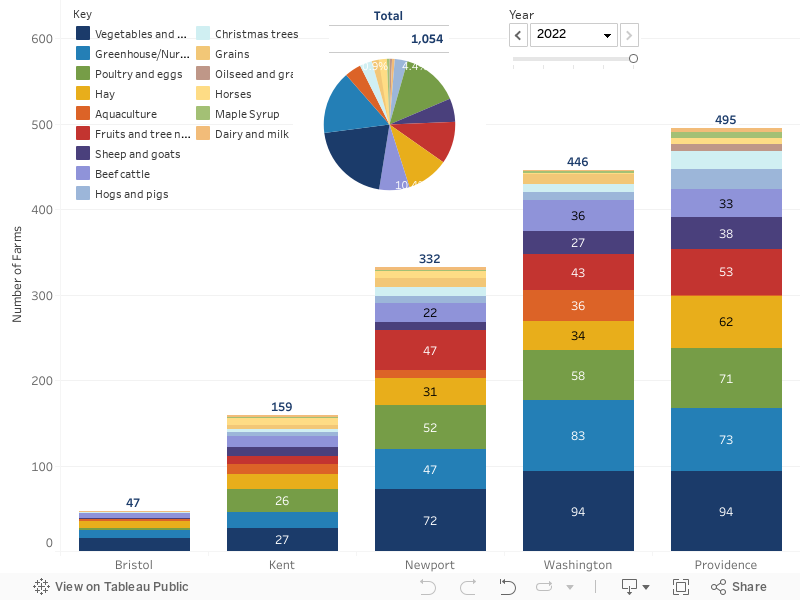
Click the Year menu on the left and use the arrows for more information.
The number of farms in Rhode Island was estimated at 1,043 in 2017 and 1,054 in 2022. Note that most farms are engaged in more than one type of agricultural activity. The bars in this figure are not mutually exclusive. Nearly 29% (302) of all farms in Rhode Island grow vegetables/melons, 22% (231) grow greenhouse/nursery products, and 20% (210) raise poultry/eggs.
Data sources: USDA Census of Agriculture, Table 2: Market Value of Agricultural Products Sold, multiple years. Adjusted for inflation to 2024 dollars. Note: USDA estimates of aquaculture sites may not align with estimates from RI Coastal Resources Management Council.
Value of Agricultural Sales by County and Category, 2017-2022
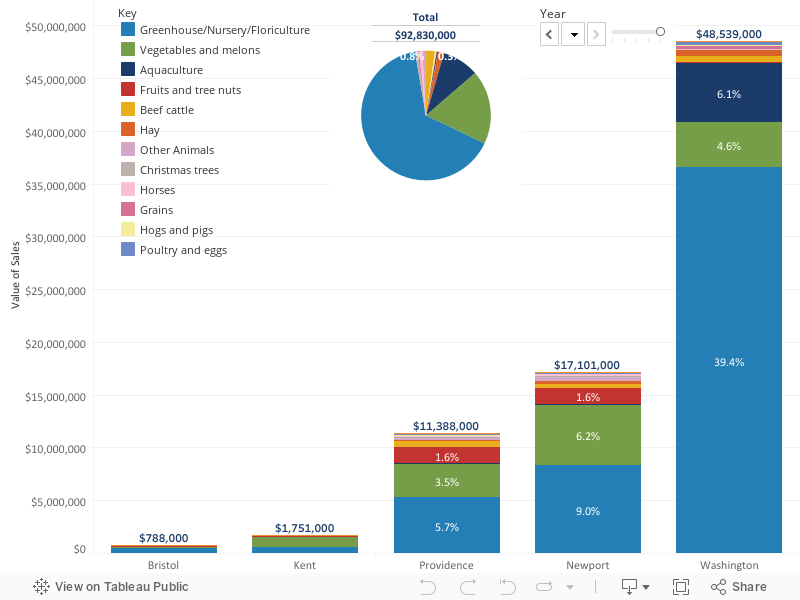
This chart has an interactive menu!
Click the Year menu on the left and use the arrows for more information.
Greenhouses/nurseries/floriculture accounted for 21.9% of farms and 56.1% of sales in 2022, and most of the sales increase from 2017 to 2022 was due to greenhouse/nursery/floriculture sales.
Washington County has the largest amount of farmland and accounted for 47.7% agricultural sales of Rhode Island counties in 2022.
Data sources: USDA Census of Agriculture, Table 2: Market Value of Agricultural Products Sold, multiple years. Adjusted for inflation to 2025 dollars.
Value of Edible Agricultural Sales by County and Category, 2017-2022
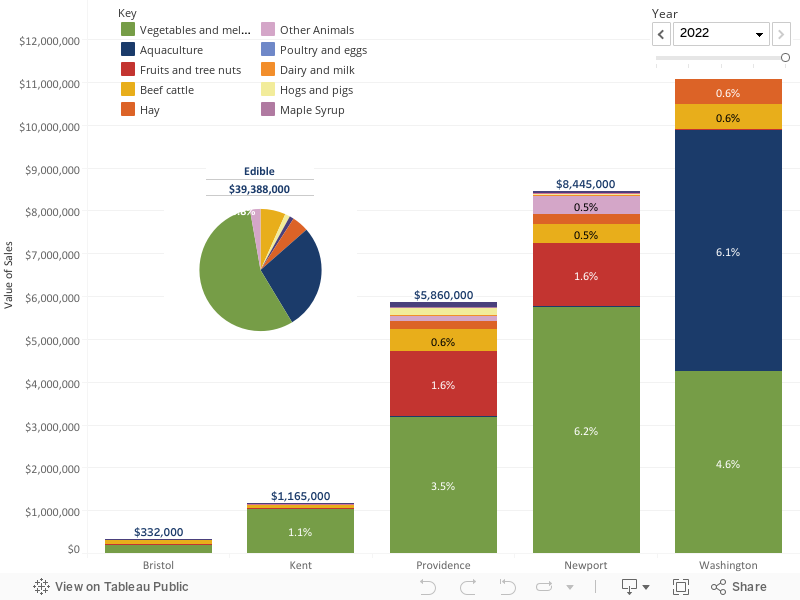
This chart has an interactive menu!
Click the Year menu on the left and use the arrows for more information.
Data sources: USDA Census of Agriculture, Table 2: Market Value of Agricultural Products Sold, multiple years. Adjusted for inflation to 2025 dollars.
Number of Farms and Value of Agricultural Sales by Economic Class, 2002-2022
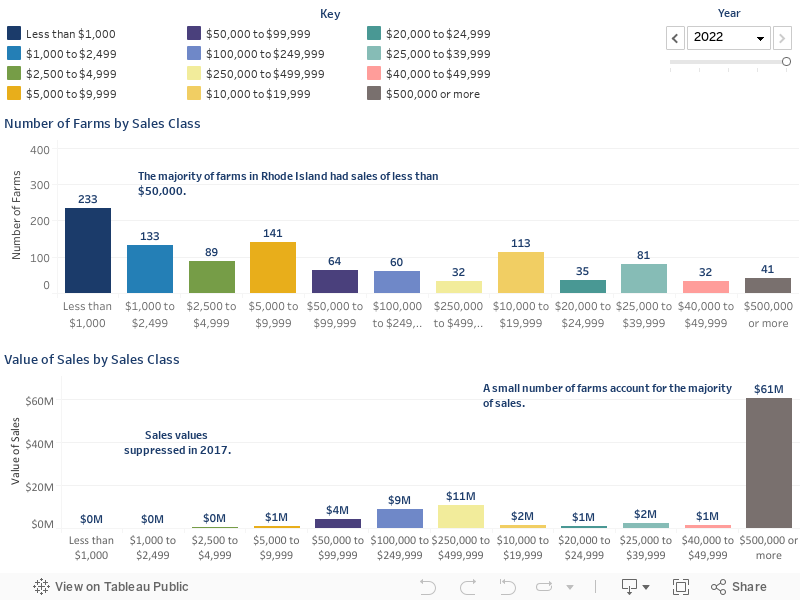
This chart has an interactive menu!
Click the Year menu on the left and use the arrows for more information.
Data sources: SDA Census of Agriculture, Table 3: Economic Class of Farms by Market Value of Agricultural Products Sold, multiple years. Adjusted for inflation to 2025 dollars.
Estimating the Value of Rhode Island’s Food System
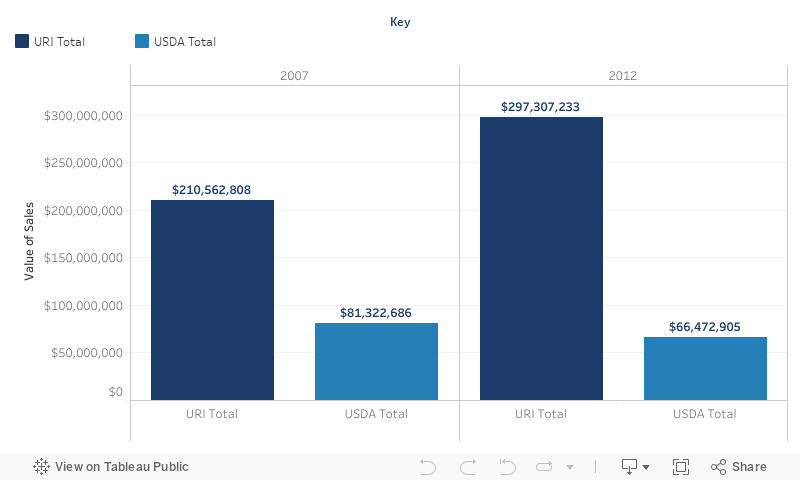
However, local research has found that the Census of Agriculture underestimates the value of food production. For example, the USDA estimate for sales in 2007 was $65.9 million ($81.3 million in 2020 dollars). Using a different approach, University of Rhode Island Professor Tom Sproul conservatively estimated that Rhode Island had agricultural sales of nearly $170.6 million in 2007, more than 2.5 times higher than the USDA estimate. A 2012 update estimated $238.9 million in sales, compared to $59.6 from the 2012 Census of Agriculture. Dr. Sproul’s estimates do match USDA estimates in the sense that greenhouse/nursery sales account for the majority of sales in his analysis.
Data sources: Dr. Thomas W. Sproul, February 1, 2015, The Economic Impact of Rhode Island Plant-Based Industries and Agriculture: An Update to the 2012 Study. USDA Census of Agriculture, multiple years.
URI Agricultural Sales Estimate, 2012
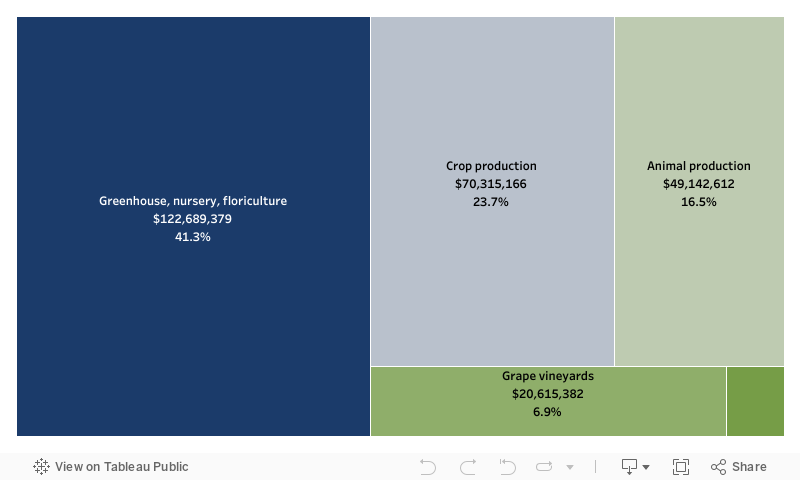
Greenhouse, nursery, and floriculture sales made up the biggest percentage, 41.3% ($122.7 million), followed by crop production, 23.7% ($70.3 million), animal production, 16.5% ($49.1 million), and smaller amounts of grape vineyards and aquaculture.
RI Food Data Discrepancies:
Available Information, Their Methodologies, and Differences
Data sources: Dr. Thomas W. Sproul, February 1, 2015, The Economic Impact of Rhode Island Plant-Based Industries and Agriculture: An Update to the 2012 Study.
Farmer Age Demographics, 2007-2022
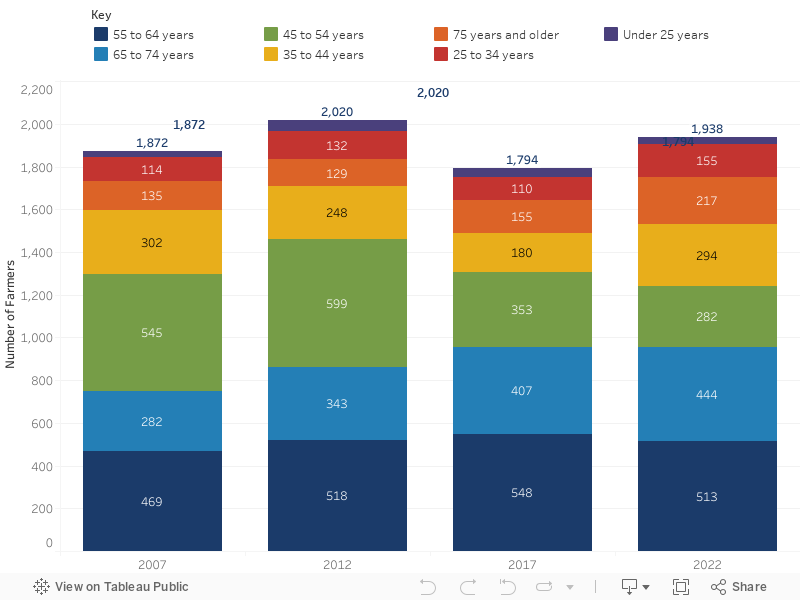
At the same time, Rhode Island actually has the highest percentage of new and beginning farmers—farmers with 10 or fewer years of experience—of any state in the country: 41.4% (802 out of 1,938) in 2022.
Data sources: USDA Census of Agriculture, Table 52: Selected Producer Characteristics, multiple years.
Young Farmers, 2017-2022
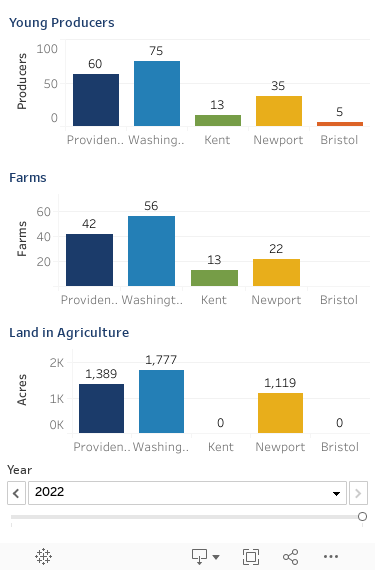
Data sources: USDA Census of Agriculture, Table 68: Young Producers.
Farmer Race Demographics, 2007-2022
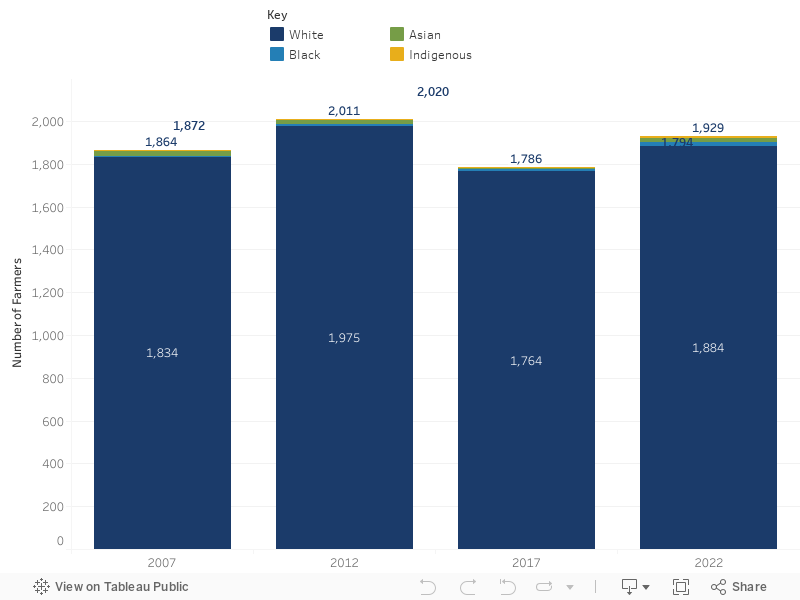
Colonization, genocide, slavery, and policies pursued by the U.S. government all played a role in the dismantling of Indigenous societies and limited access to agricultural land for non-White people. Today, Black, Indigenous, Asian, and Hispanic Americans own a very small percentage of farms and agricultural land.
Farm ownership in both the state and the country continues to be a mostly White-owned enterprise: White people make up 60% of our country’s population, but comprise 92% of producers, own 96% of farms, and operate 94% of land in agriculture. As of July 2022, 69.9% of Rhode Islanders were White (not Hispanic), but 97.2% of Rhode Island farmers were White. Black Americans make up 9.1% of Rhode Island’s population, but only 1.0% of farmers.
Data sources: USDA Census of Agriculture, Table 62: Selected Producer Characteristics by Race, multiple years.
Farmer Demographics by Hispanic Ethnicity, 2007-2022
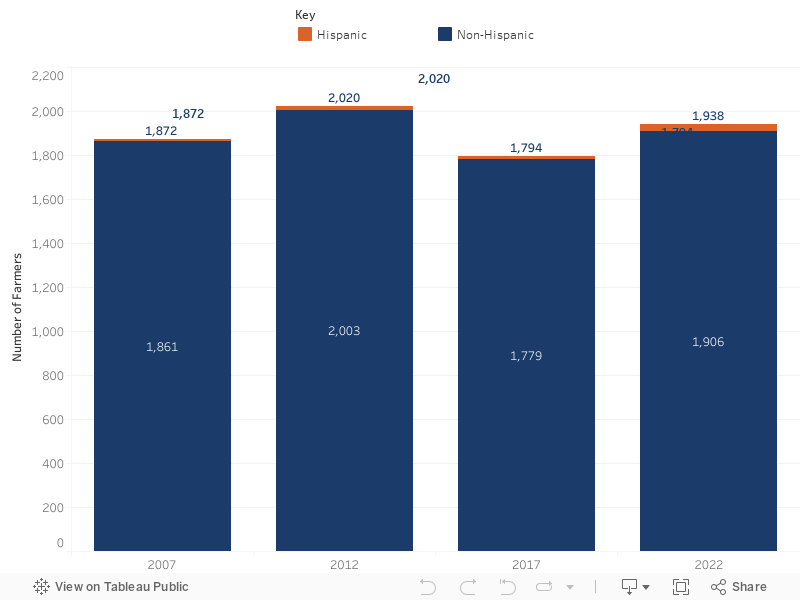
Hispanic Rhode Islanders–the state’s largest ethnic group–make up 17.6% of the state’s population, but make only 1.7% of farmers.
Data sources: USDA Census of Agriculture, Table 60: Hispanic, Latino, or Spanish Origin Producers, multiple years.
Farmer Sex Demographics, 2007-2022
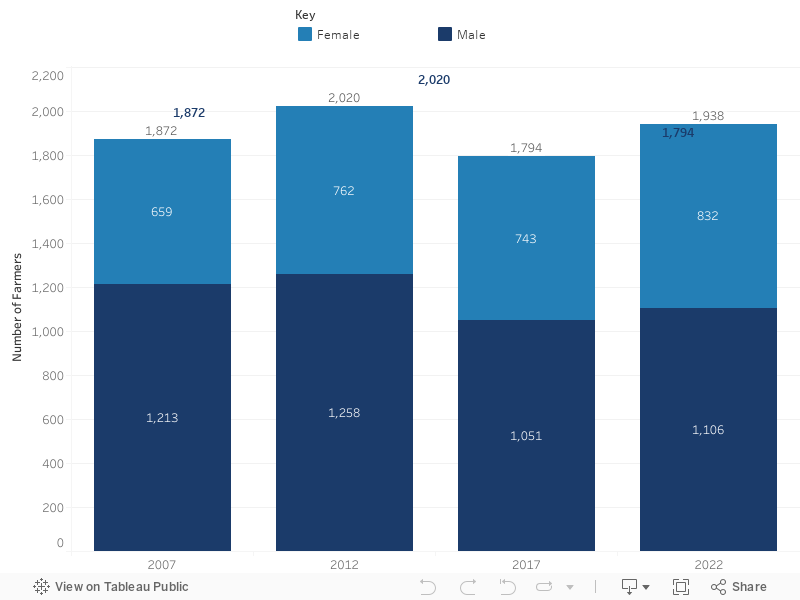
Women make up 51% of Rhode Island’s population but 42.9% (832) of farmers. This percentage does represent an increase from 35% (659) of farmers in 2007.
Data sources: USDA Census of Agriculture, Table 58: Female Producers, multiple years.