
How to get the most out of this dashboard
- Read through from top to bottom to get the whole story
- Scroll over the charts to get nitty gritty details
- Click on a color in the Key to hone in on that selection
- Enter Full Screen Mode by clicking this button
 in the lower right of each chart
Note: Dollar values are adjusted for inflation to 2025 dollars.
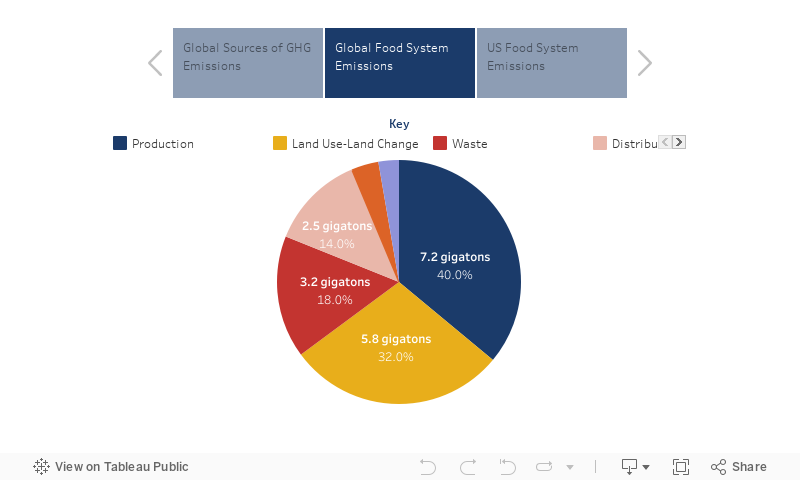
Global Food System Greenhouse Gas Emissions
This chart has interactive tabs!
Click each tab on the left for more information.

Food production, harvesting, transportation, processing, packaging, refrigeration, cooking, and disposal are responsible for a significant amount of greenhouse gas emissions (GHG). How much? The Emissions Database for Global Atmospheric Research (EDGAR) estimates that food system activities are responsible for about 35% (18 gigatons) of global GHG emissions.
Globally, production practices, land use changes (e.g., deforestation to grow soybeans), and waste generation account for 90% of food system GHG emissions. Food system emissions are estimated to account for 25% of total U.S. GHG emissions. Production practices, transportation, and the retail sector are estimated to account for 70% of U.S. food system GHG emissions.
Note: a gigaton is equal to 1 billion tons.
Data sources: Crippa, M., Solazzo, E., Guizzardi, D. et al. “Food Systems are Responsible for a Third of Global Anthropogenic GHG Emissions. Nat Food (2021). doi:10.1038/s43016-021-00225-9.
Rhode Island’s Greenhouse Gas Emissions Inventory, 1991-2023
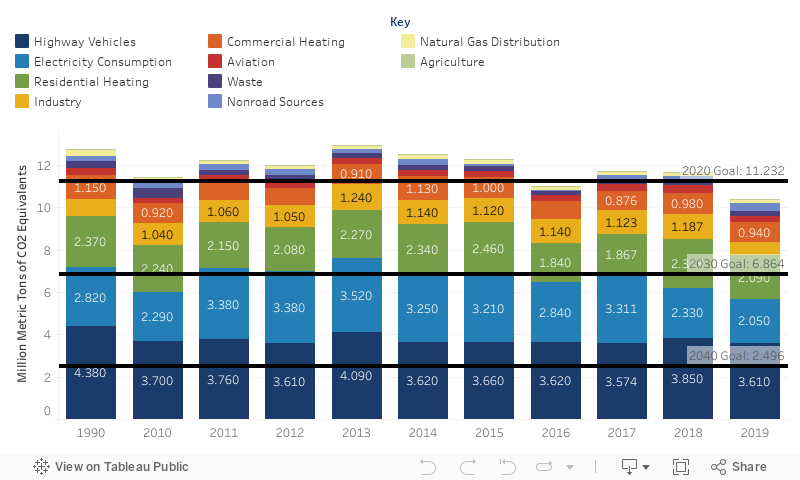
The 2021 Act on Climate set greenhouse gas (GHG) emissions reduction targets of 10% below 1990 levels by 2020, 45% below 1990 levels by 2030, 80% below by 2040, and net-zero emissions by 2050.
Net greenhouse gas emissions decreased 19.4% from 11.81 MMCO2e in 1990, to 9.52 MMCO2e in 2023. Transportation continues to be the largest source of emissions in Rhode Island. Additional substantial decreases are required to meet 2030 and 2040 mandates.
Applying the estimate that 25% of U.S. GHG emissions are generated by food system activities to Rhode Island yields a result of over 2.3 million tons of carbon dioxide equivalents. This is a much higher value than the estimate for just agricultural GHG emissions.
Data Sources: Rhode Island Department of Environmental Management, 1990-2023 Rhode Island Greenhouse Gas (GHG) Emissions Inventory. Note: GHG emissions and sinks are recalculated by DEM each year based on the best available data.
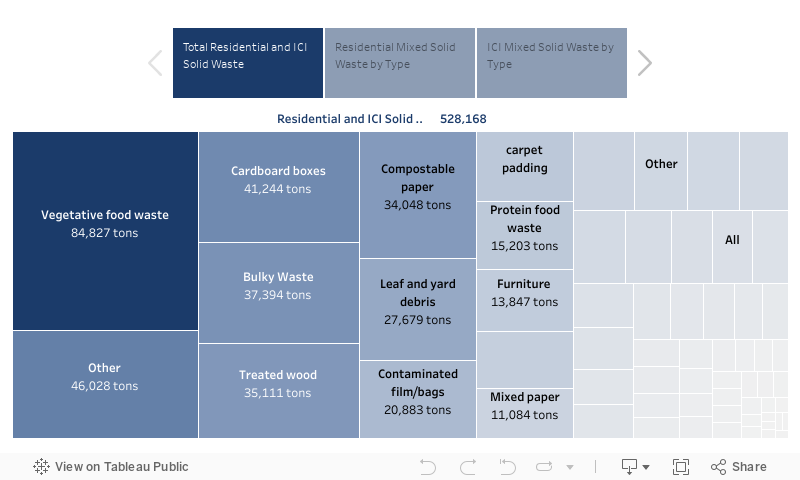
Food Waste is the Most Prevalent Material in Rhode Island’s Waste Stream
Click each tab on the left for more information.
Data sources: DSM Environmental Services, Inc. et al., 2015, Rhode Island Solid Waste Characterization Study.
Rhode Island is Getting Hotter
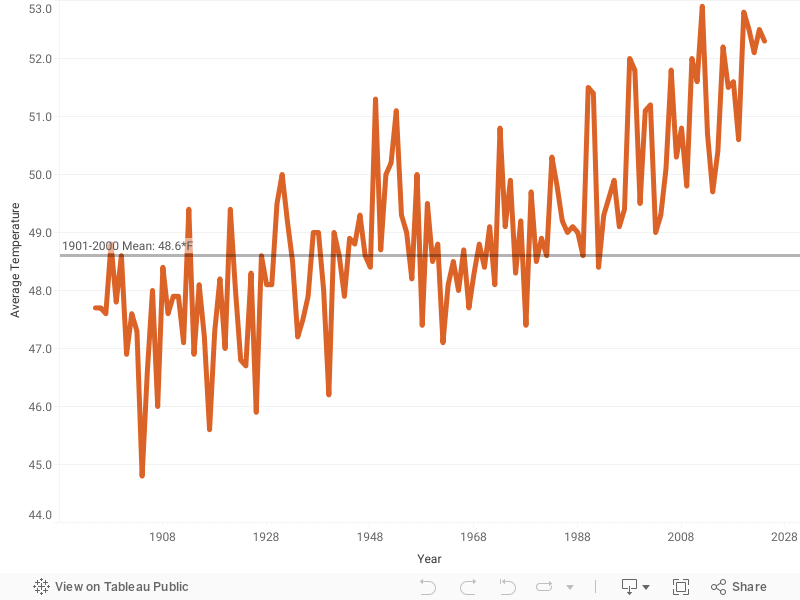
2025 was the third warmest year on record and the past ten years—2015-2025—were the ten warmest on record.
Warmer temperatures can impact both crop and livestock production, and harm people working outdoors.
Data sources: NOAA National Centers for Environmental Information, Climate at a Glance Statewide Time Series.
Mean Sea Level is Up Over 1 Foot in Past 100 Years

Data sources: NOAA Tides & Currents. Note: negative values mean the land was rising more quickly than the ocean was rising.
The Ocean Around Rhode Island Is Getting Warmer
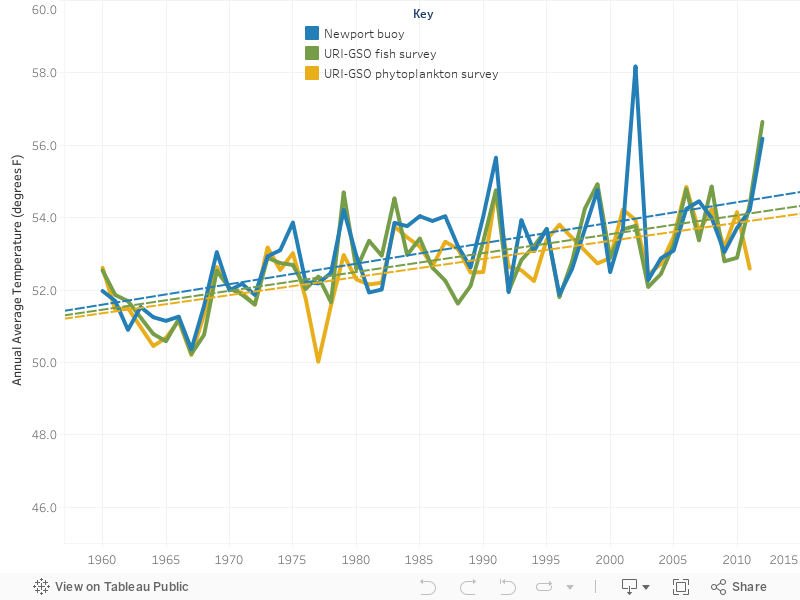
Ocean temperatures have also increased due to climate change. Readings from three locations in Narragansett Bay indicate about a 4 degree change from 1960 to 2012, a trend that has certainly increased. Some evidence shows that cold-water iconic fishery species like cod, winter flounder, hake, and lobster are migrating out of Rhode Island waters, while warm-water species like scup, butterfish, and squid are moving in.
Data sources: Narragansett Bay Estuary Program, Temperature data.
Climate Risks in New England
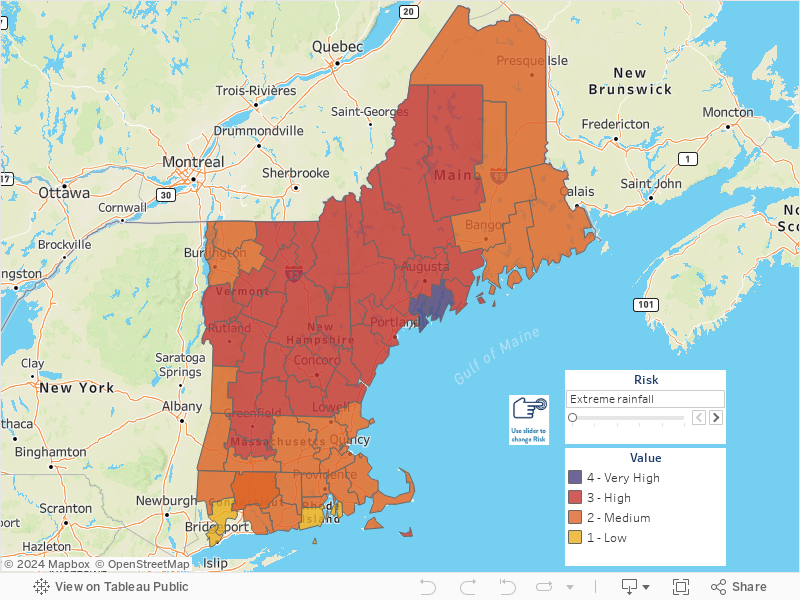
Click the Risk menu on the left and use the arrows for more information.

As greenhouse gas emissions have increased, the frequency and severity of climate change risks have also grown around the world. The New York Times and Four Twenty Seven (a climate change consulting firm) identified the top climate risks for every county in the country. Across New England, the top risks are hurricanes and extreme rainfall. The frequency and severity of hurricanes and extreme rainfall events are both predicted to increase. Rhode Island is also expected to experience a high risk of future water stress (e.g., drought-like conditions).
Data sources: Stuart A. Thompson and Yaryna Serkez, September 18, 2020, “Every Place Has Its Own Climate Risk. What Is It Where You Live?” The New York Times.
Rhode Island Has Recently Experienced Abnormally Dry Conditions
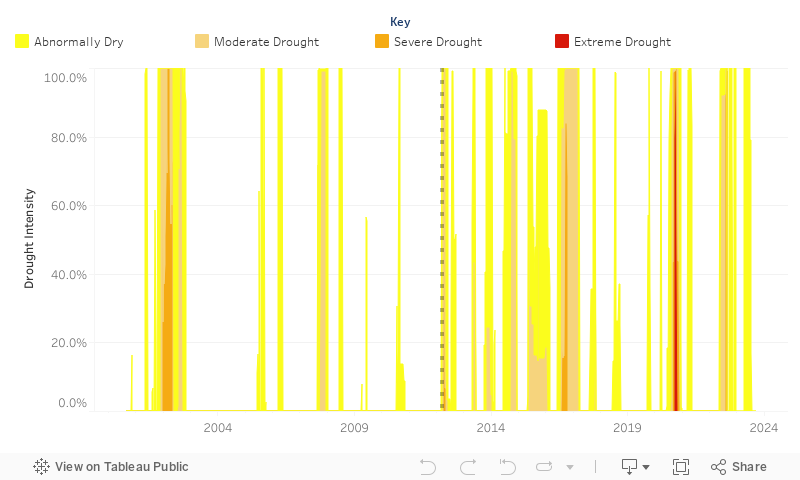
Data sources: U.S. Drought Monitor, State Time Series.
Rhode Island Billion-Dollar Weather and Climate Disasters
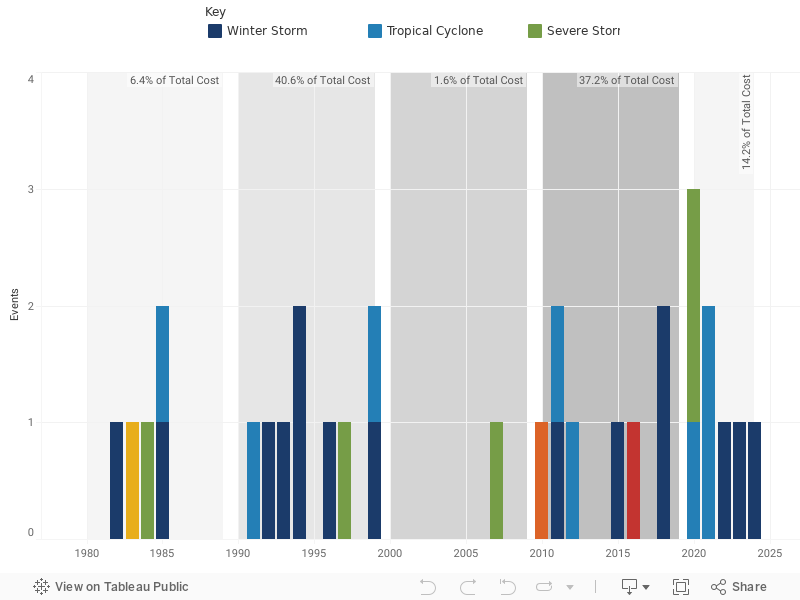
The National Centers for Environmental Information tracks weather and climate disasters where damages reached or exceeded $1 billion. Since 1980, the United States has sustained 373 disasters that have cumulatively cost over $2.645 trillion.
Rhode Island has experienced 33 events, with a total cost between $2-$5 billion. Note that the cost of each billion-dollar weather and climate disaster are borne by multiple states, particularly in the tightly clustered Northeast. While winter storms have been the most common type of billion-dollar disaster, tropical cyclones/hurricanes are the costliest type of disaster. In the 29 years from 1980 to 2009, Rhode Island experienced 3 hurricanes. In the 13 years between 2010 and 2023, the state has experienced 5 hurricanes.
The 1990s were the most costly climate disaster decade due to the impacts of Hurricane Bob in 1991, Hurricane Floyd in 1999, and 6 winter storms. The 2010s were the second costliest climate disaster decade due to tropical storms Irene in 2011 and Sandy in 2012. The first three years of the 2020s combined for 11.4% of the total cost of climate disasters that have impacted Rhode Island, mostly due to the impacts of tropical storms Elsa and Henri.
Data sources: NOAA National Centers for Environmental Information, Billion-Dollar Weather and Climate Disasters. Note: the federal government discontinued this research project and it has been reconstructed by Climate Central.