How to get the most out of this dashboard
- Read through from top to bottom to get the whole story
- Scroll over the charts to get nitty gritty details
- Click on a color in the Key to hone in on that selection
- Enter Full Screen Mode by clicking this button
 in the lower right of each chart
Note: Dollar values are adjusted for inflation to 2025 dollars.
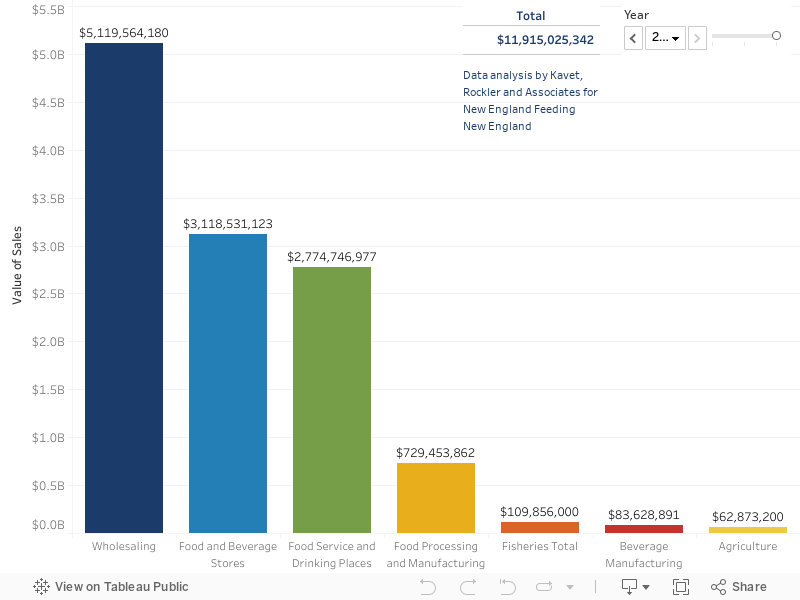
Total Food System Sales, 2017-2022
This chart has an interactive menu!
Click the Year menu on the left and use the arrows for more information.

Data sources: Data from U.S. Census Bureau Economic Census, USDA Census of Agriculture, U.S. Census Bureau Nonemployer Statistics, Atlantic Coast Cooperative Statistics Program Data Warehouse, and Rhode Island Coastal Resources Management Council for 2017 and 2022 were used. Adjusted for inflation to 2025 dollars. The value for Agriculture sales does not include the Census of Agriculture estimate of aquaculture sales; the value of aquaculture is provided by the Rhode Island Coastal Resources Management Council.
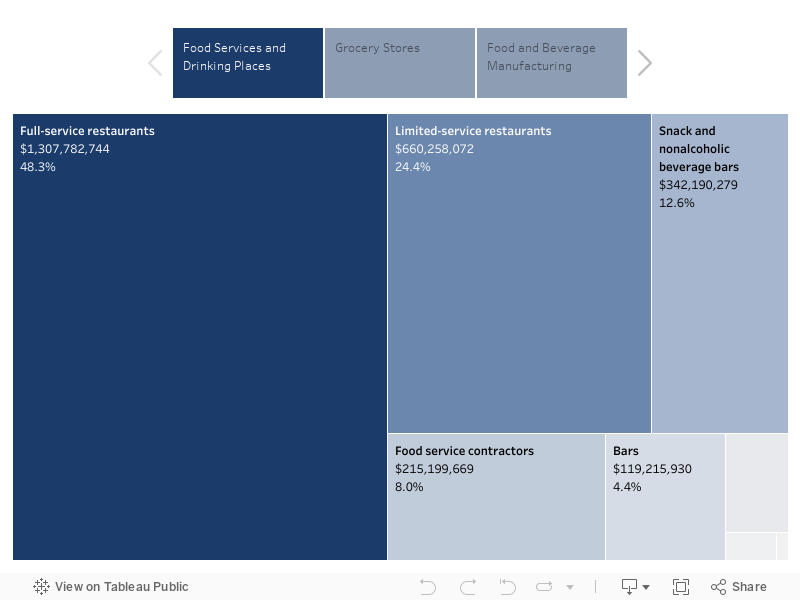
Food System Sales by Sector, 2017-2022
This chart has interactive tabs!
Click each tab on the left for more information.

Grocery stores, warehouse clubs, and full-service and limited-service restaurants account for 80% of retail food sales. Note that direct sales—from farmer to consumer via farmstands, CSAs, and farmers markets—accounted for 0.1% of total retail food sales.
Animal slaughtering and processing accounted for about 30% of food and beverage manufacturing sales, followed by “other food manufacturing,” a catchall category that covers all kinds of snacks and processed food, and bakeries.
Data sources: Data from U.S. Census Bureau Economic Census, USDA Census of Agriculture, and U.S. Census Bureau Nonemployer Statistics, for 2017 and 2022 were used. Adjusted for inflation to 2025 dollars.
Food System Employment Compared to Total Employment, 2002-2024
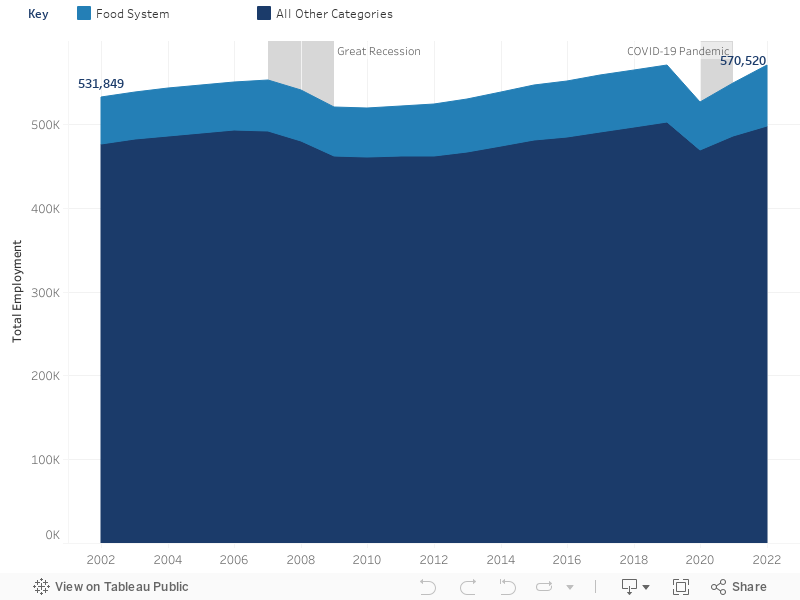
Total employment in Rhode Island increased 11.0% from 2002 (531,849) to 2024 (590,420). Food system jobs account for about 12.9% (75,210) of all jobs in Rhode Island. This is likely an undercount because we are unable to specify all possible food system jobs (e.g., “general freight trucking” accounts for over 1,500 jobs in Rhode Island. However, although all food ultimately moves via transportation, we can’t delineate trucking jobs that are exclusively for food distribution).
Data sources: U.S. Bureau of Labor Statistics, Quarterly Census of Employment and Wages and U.S. Census Bureau Nonemployer Statistics.
Food System Employment by Category, 2002-2024
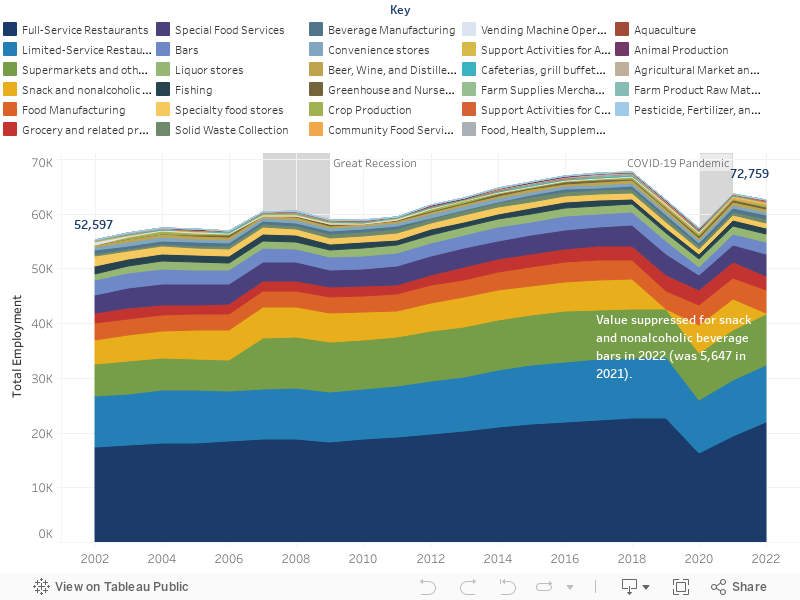
Total food system jobs in Rhode Island increased 36.1%, from from ≈55,000 in 2002 to over 75,000 in 2024. “Food services and drinking places” (e.g., restaurants, fast food, institutional food services, bars) account for the majority of food system jobs – over 47,000 jobs.
(Note that farmers and hired farm workers are not counted here for methodological reasons).
Data sources: U.S. Bureau of Labor Statistics, Quarterly Census of Employment and Wages and U.S. Census Bureau Nonemployer Statistics.
Restaurants and Bars Employment, 2002-2024
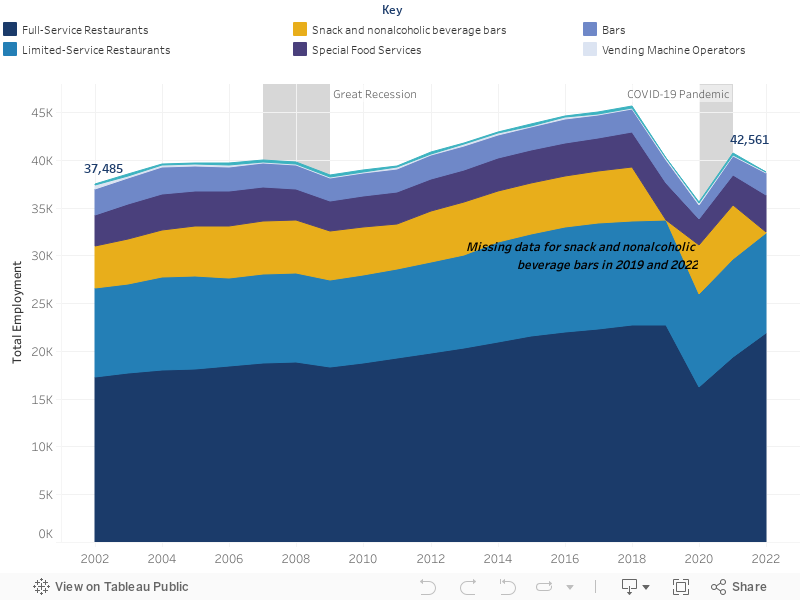
Data sources: U.S. Bureau of Labor Statistics, Quarterly Census of Employment and Wages and U.S. Census Bureau Nonemployer Statistics.
Grocery Store Employment, 2002-2024
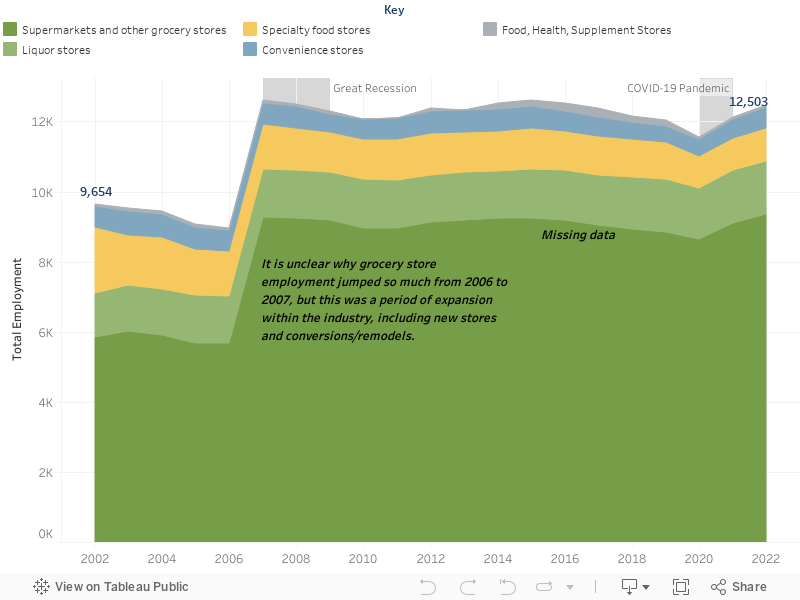
The total number of grocery stores in Rhode Island has essentially stayed at 1,000 stores over the past 20 years.
Data for “warehouse clubs and supercenters” in Rhode Island began to be reported in 2022.
Data sources: U.S. Bureau of Labor Statistics, Quarterly Census of Employment and Wages and U.S. Census Bureau Nonemployer Statistics.
Food and Beverage Manufacturing Employment, 2002-2024

Data sources: U.S. Bureau of Labor Statistics, Quarterly Census of Employment and Wages and U.S. Census Bureau Nonemployer Statistics.
Food Distribution Employment, 2002-2024
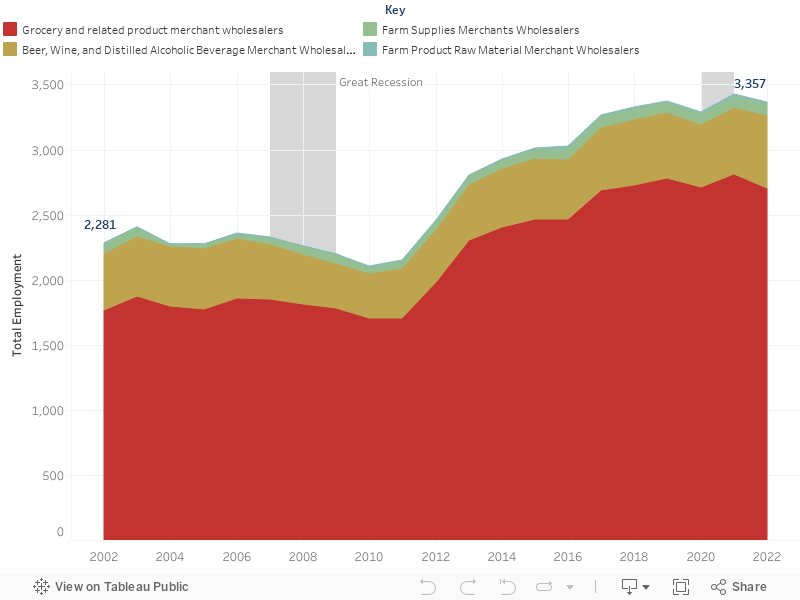
United Natural Foods (UNFI), based in Providence, is the largest publicly traded wholesale distributor of natural, organic, healthy, and specialty food in the country – and is likely a major employer in Rhode Island.
Data sources: U.S. Bureau of Labor Statistics, Quarterly Census of Employment and Wages and U.S. Census Bureau Nonemployer Statistics.
Food Production Employment, 2002-2024
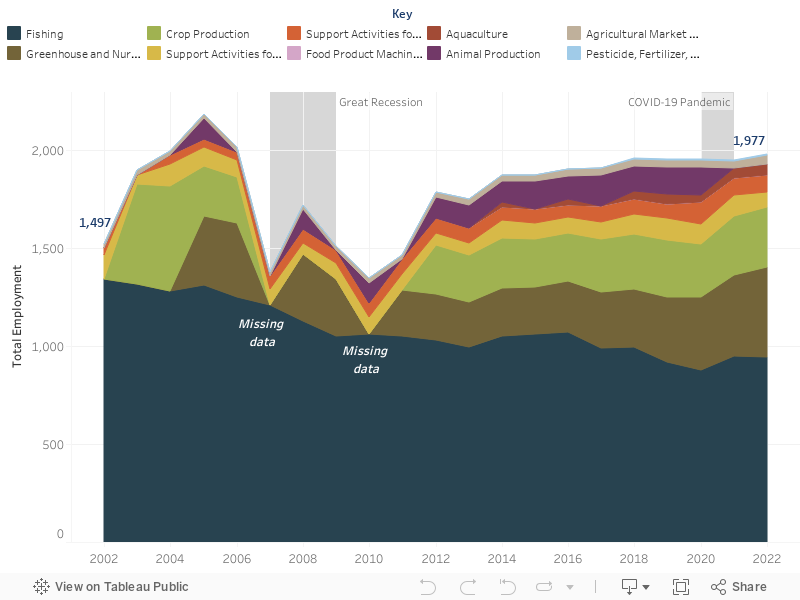
Taken together, available data sources suggest that more than 4,000 people are employed in food production (over 1,900 in fishing and support activities, and more than 3,000 as farmers and hired farm workers). And there are more than 2,200 food production businesses, including farms and fishing operations.
Data sources: U.S. Bureau of Labor Statistics, Quarterly Census of Employment and Wages and U.S. Census Bureau Nonemployer Statistics.
Farm Employment, 2002-2022
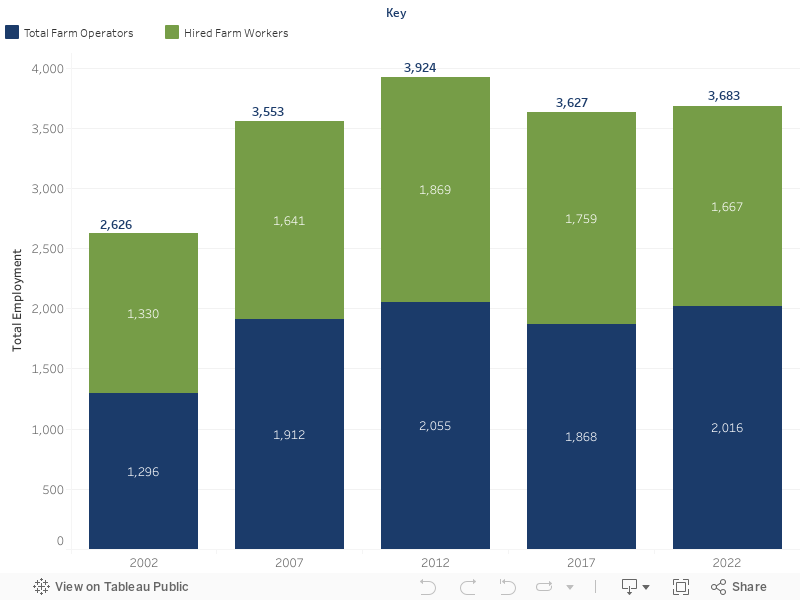
Data sources: U.S. Department of Agriculture, Census of Agriculture.
URI Agriculture Job Estimates, 2012
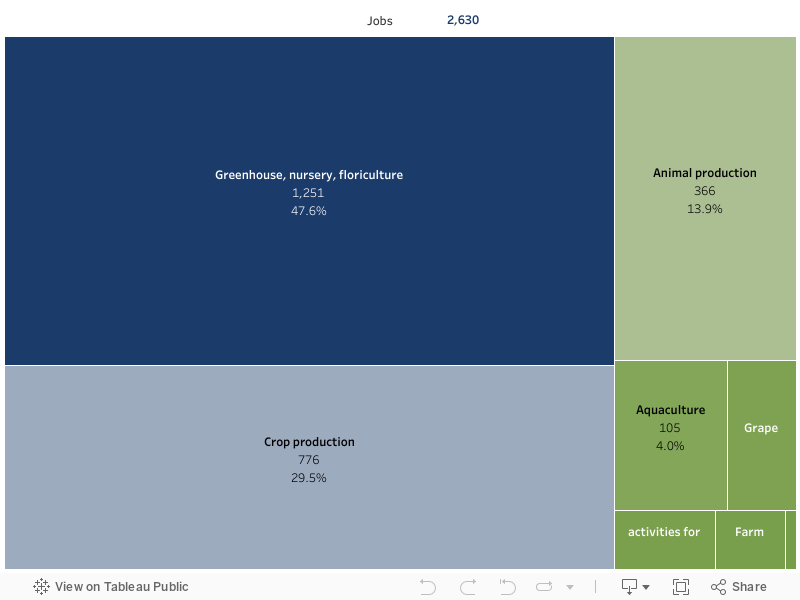
The biggest job generator was Greenhouse/Nursery/Floriculture (47.6%), followed by crop production (29.5%), animal production (13.9%), and lesser numbers for aquaculture, grape vineyards, support activities for animal production (e.g., hay fields), farm machinery and equipment sales, and farm management.
Data sources: Dr. Thomas W. Sproul, February 1, 2015, The Economic Impact of Rhode Island Plant-Based Industries and Agriculture: An Update to the 2012 Study.
Median Hourly Wages for Rhode Island Occupations
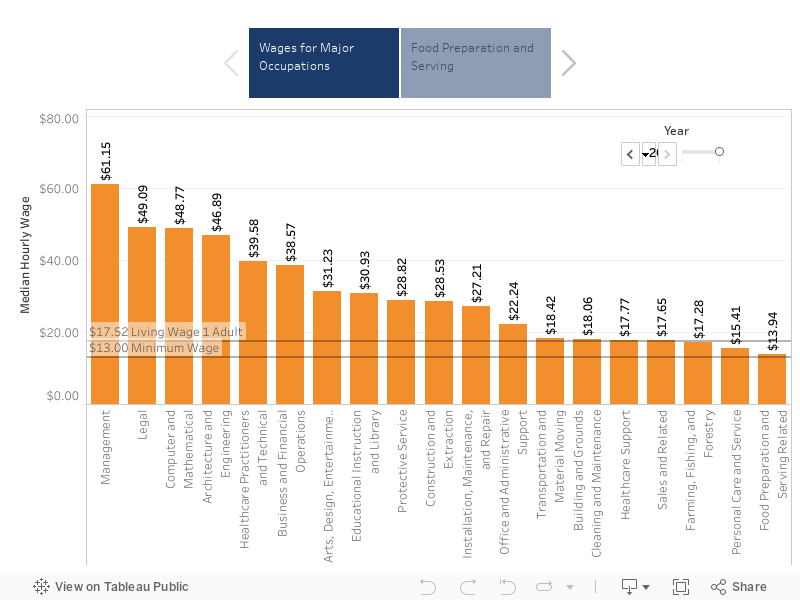
This chart has interactive tabs!
Click each tab on the left for more information.
Data sources: U.S. Bureau of Labor Statistics, Occupational Employment and Wage Statistics. MIT, Living Wage Calculator.
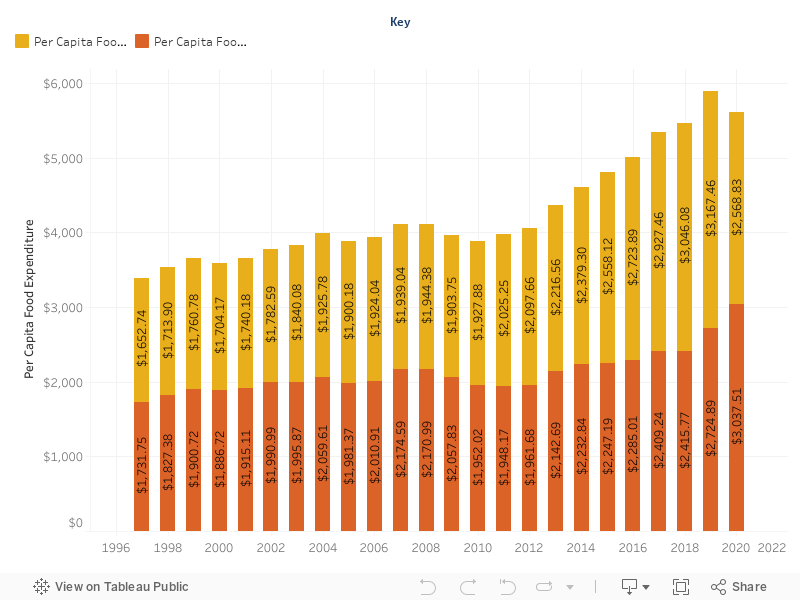
Rhode Island Per Capita Food Expenditures, 1997-2024