
How to get the most out of this dashboard
- Read through from top to bottom to get the whole story
- Scroll over the charts to get nitty gritty details
- Click on a color in the Key to hone in on that selection
- Enter Full Screen Mode by clicking this button
 in the lower right of each chart
Note: Dollar values are adjusted for inflation to 2025 dollars.
Commercial Seafood Landings (Pounds), 2000-2024
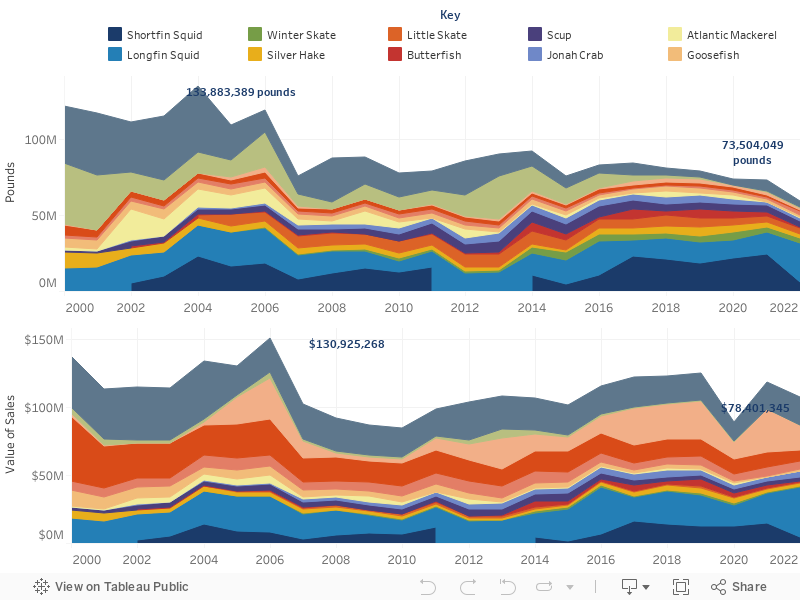
Across New England fisheries, an observed decline in pounds caught has been primarily driven by a decrease in Atlantic herring catch due to historic overfishing, changing environmental conditions, and new regulations. This trend is also evident for Rhode Island fishermen, although total sales have been steady since 2007.
Commercial Seafood Landings (Value), 2000-2024

Data sources: Atlantic Coastal Cooperative Statistics Program. Adjusted for inflation to 2025 dollars.
Number of Fishermen Contributing to Harvest by Species
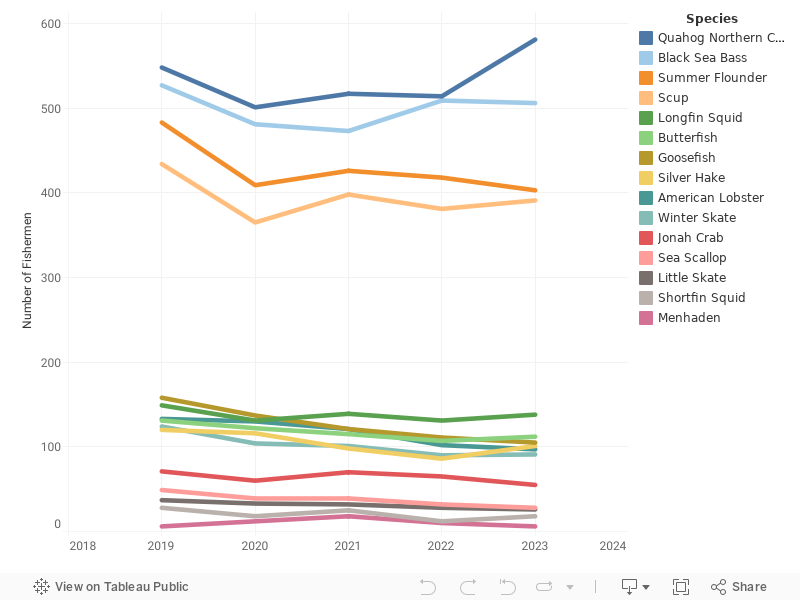
Data sources: Rhode Island Department of Environmental Management Division of Marine Fisheries, 2025, Rhode Island Annual Fisheries Report: 2024.
Rhode Island Aquaculture Production, 2000-2024
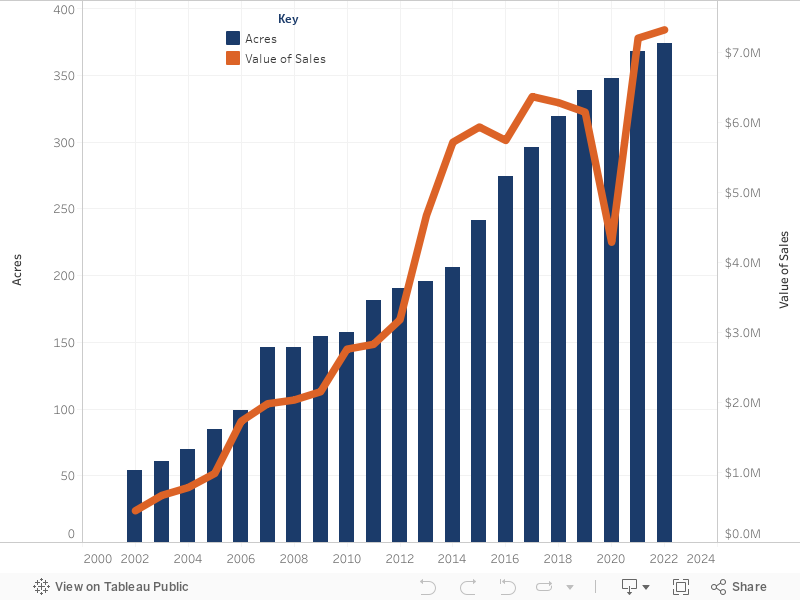
Data sources: RI Coastal Resources Management Council, Aquaculture in Rhode Island 2024. Adjusted for inflation to 2025 dollars.
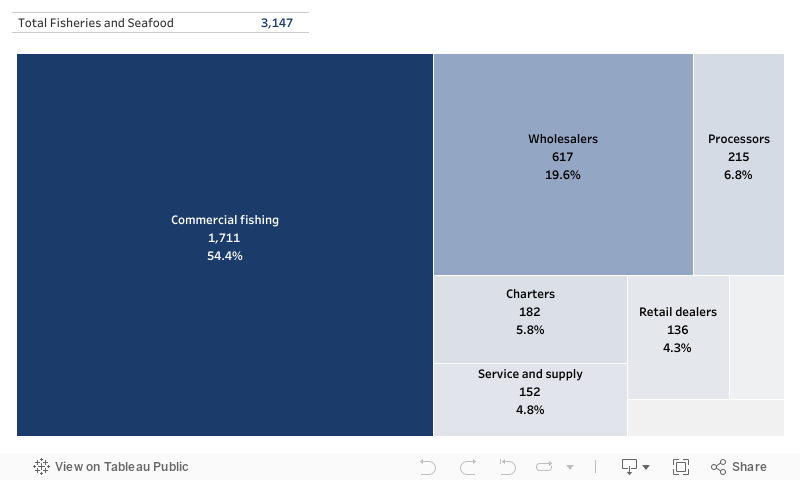
Gross Sales of Rhode Island’s Seafood and Fisheries Sector, 2016
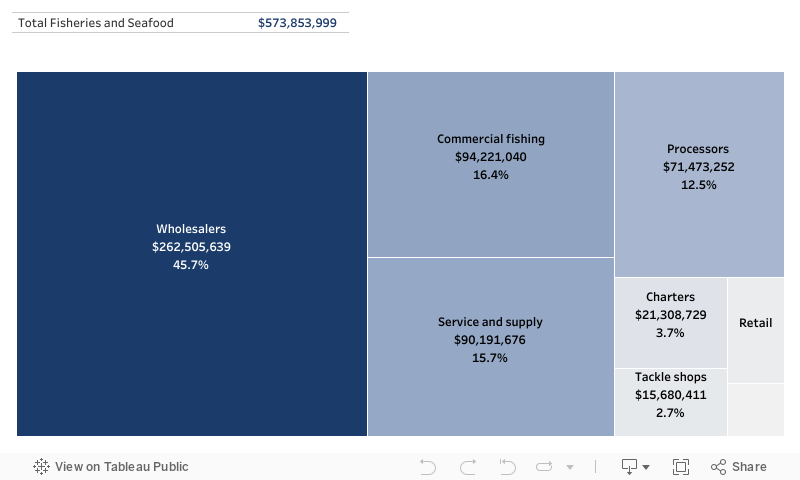
Data Sources: Dr. Thomas Sproul and Clayton Michaud, 2019, The Economic Impact of Rhode Island’s Fisheries and Seafood Sectors.
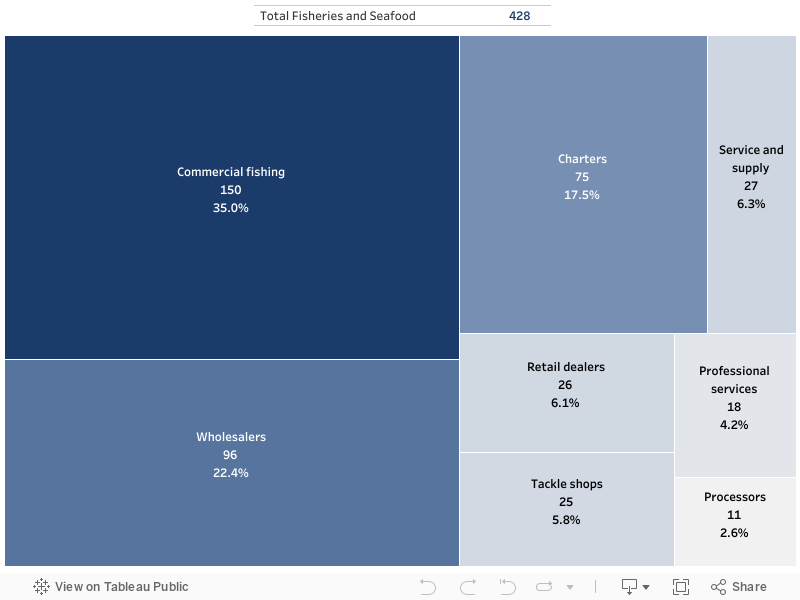
Employment in Rhode Island’s Seafood and Fisheries Sector, 2016
Data sources: Dr. Thomas Sproul and Clayton Michaud, 2019, The Economic Impact of Rhode Island’s Fisheries and Seafood Sectors.
Businesses in Rhode Island’s Seafood and Fisheries Sector, 2016
Data Sources: Dr. Thomas Sproul and Clayton Michaud, 2019, The Economic Impact of Rhode Island’s Fisheries and Seafood Sectors.